Tuesday, November 28, 2017

Stratospheric Warming Event Precludes Cold Outbreak in December

A pending stratospheric warming event, which I initially discussed in a post a few days ago, looks to preclude an outbreak of colder than normal air in mid-December.

CPC
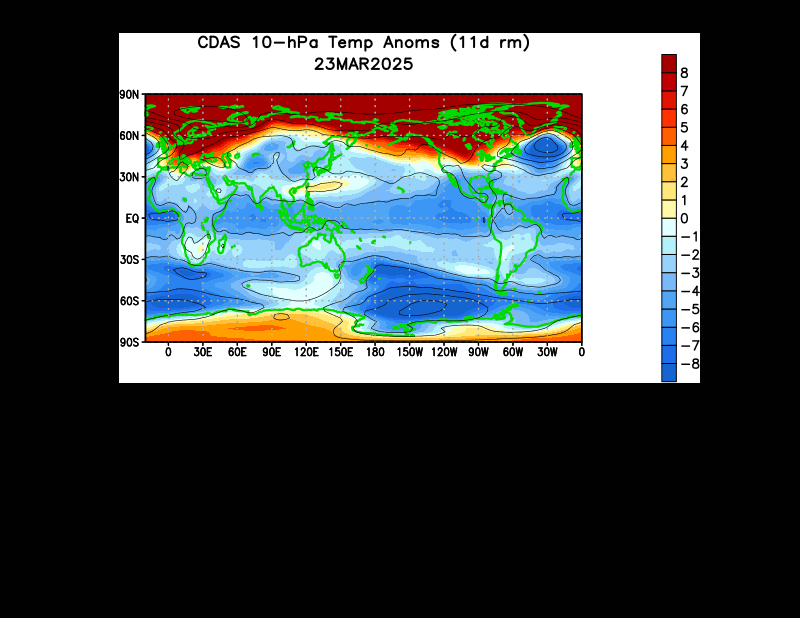
We begin with an animation of the 30-millibar temperature anomalies, from the Climate Prediction Center. As previously discussed, we've seen two areas of warmer than normal temperatures merge over Eurasia after forming in Western Europe and East Asia. Since the previous post, we have seen this body of warmer than normal temperatures intensify, but also begin sliding north and east at an accelerated pace, towards extreme northeast Russia and the Bering Sea.

Typically, stratospheric warming events originate from the Bering Sea region. This happens because, most often, bodies of warmer than normal air form over East Asia, and the easiest route northward into the Arctic Circle is through the Bering Sea. This time around, however, the stronger pool of warm air over Europe absorbed the East Asian pool of warm air, and they're now one big area of warm air over northern Eurasia.

I noted that this warm air is accelerating and moving northeast because this is typically a signal that it's "crunch time" for the warm air. In other words, it's making its move north into the Arctic Circle now, so it must either actually make it into the Arctic Circle, or be rejected and stay at lower latitudes, where it may then dissipate. From this animation, it looks like the warm air will take the former option, but let's look at the 50-millibar level for clarification.

CPC
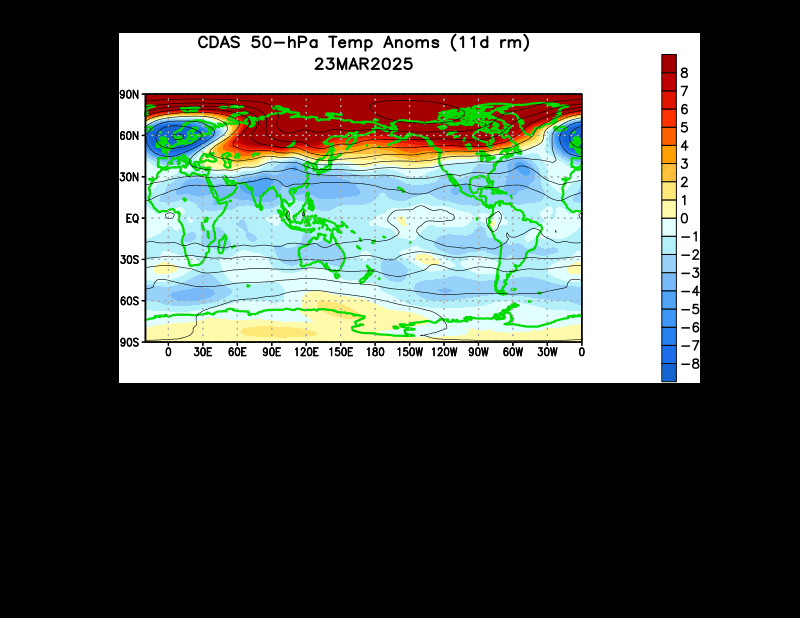
An animation of the 50-millibar temperature anomalies reveals a very similar picture to what we just saw at the 30-millibar level. A key difference, however, is the blossoming of the warmer air temperatures a little further north and east than at the 30-millibar level, and this pool of warmer air also looks like it's about to make its move to try and get into the Arctic Circle. We can already see some warmer temperature anomalies blossoming into the Arctic Circle at the very top of the animation, just northwest of Alaska, and this is a promising sign for the warmer temperatures in the sense that they should be able to push north and initiate a stratospheric warming event.

CPC
At the moment, the 50-millibar layer that we just looked at currently looks like this. Above is a temperature map (not anomalies, but actual temperatures) of the 50-millibar level as of last night. We can clearly see the warm pool located just west of the Aleutian Islands, as well as its main opponent, the polar vortex, located over Greenland. Let's step forward in time and see what the GFS predicts will play out in ten days.

CPC
By the 10-day mark, we see a battle ongoing between that pool of warmer air (which by this time appears to have intensified further), and the polar vortex at this part of the stratosphere (which looks to have weakened a bit and become displaced into northern Asia). Of course, this is a ten day forecast so it's quite possible the actual result does not resemble this image, but with forecast models generally agreeing on something like this evolving, I expect to see this forecast verify more or less as pictured, with the pool of warm air still encroaching on the polar vortex at the 50-millibar level.

So, we've established that a stratospheric warming event (but not an SSW) is expected to occur in coming days. What will we experience here on the surface?

Penn State
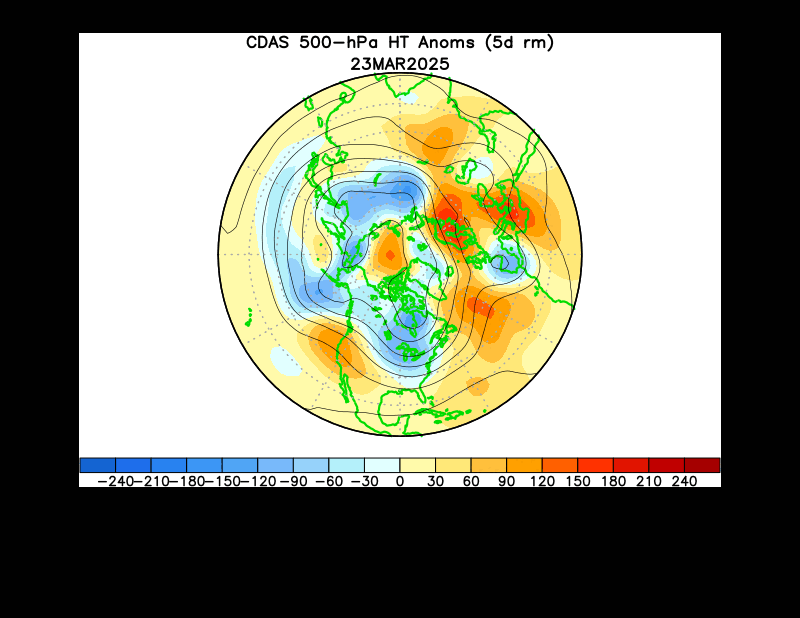
Both the GFS (left) and ECMWF (right) predict a wavenumber-3 pattern evolving at the 500-millibar level in the 8-10 day window, with those three ridges pushing way up into the Arctic Circle, centered in the Pacific Northwest, Greenland, and Eurasia. You'll notice some discrepancies, such as the ridge actually becoming cut off in the GFS panel and the Greenland ridge not nearly as stout as shown in the ECMWF panel, but the main idea of this wavenumber-3 pattern evolving in the medium-term is in pretty strong agreement between these two models.

You may also notice just how favorable of a pattern this is for cold weather in the Central and especially Eastern U.S. The positive Pacific North American (PNA) index pattern, evidenced by the strong ridge along the west coast of North America, sends the jet stream well north into Canada, and then crashing back south into the Plains, and typically further south than normal, such as near the Gulf Coast. This pattern alone is favored to bring chilly air to the aforementioned regions, but it's the negative North Atlantic Oscillation (NAO) pattern that "seals the deal" here.

The negative NAO is shown by the ridge over Greenland, which similarly forces the jet stream well to the north, like we saw with the positive PNA pattern. This time, however, it is pushed so strongly north that on either side of the ridge, depressions in the jet stream form. If you enjoy the technical side of weather, you'll see this is a Rossby Wave orientation. That depression in the jet stream to the west of Greenland allows the jet stream to buckle south even further into the Southeast U.S., before pushing up north along the East Coast. That's why you may hear Eastern U.S. winter weather fans get excited about a negative NAO pattern, because it bends the jet stream so the storm track goes right up along the East Coast for those (in)famous Nor'easters.

But what about the longer-range? I'm glad you asked!

CPC
The CFS climate model "weeklies" paint a similar picture to the GFS and ECMWF- where as the two models above forecast the atmosphere out until ~12/8 in that picture, the CFS model above provides forecasts for the 12/12 - 12/18 period and the 12/19 - 12/25 period. As you might expect, the first period is a continuation of the pattern displayed in the GFS & ECMWF, with very cold conditions in eastern North America surrounded by warmer than normal air temperatures in the Western U.S. and in Greenland, thanks to the +PNA and -NAO features described above.

The forecast for Week 4 takes the foot off the gas to some extent, returning the depth of the cold air north into Canada but still leaving the Mid-Atlantic and overall Northeast with some cooler weather.

To Summarize:

- A stratospheric warming event is likely to occur in the coming days, most notably at the 30-millibar level and below (i.e. 50-millibar, 70-millibar....).
- This is unlikely to be an SSW event.
- Colder than normal weather is likely in the Central and East U.S., as well as eastern Canada, for the second and third weeks of December.
- A moderation in the weather is then expected for the Eastern U.S. by Christmas, while cold weather persists in eastern Canada.
- I'm not yet confident enough to predict any possible snowstorms in this pattern, and will wait until the pattern actually presents itself before trying to make such predictions.

Andrew

Saturday, November 25, 2017

Stratospheric Warming Event Appears Imminent

It looks like a stratospheric warming event is preparing to occur in the far upper latitudes across multiple layers of the atmosphere. However, as we'll see, this does not look to be either a Sudden Stratospheric Warming (SSW) event, nor an event strong enough to seriously destabilize the stratospheric polar vortex.

CPC
Animation of temperature anomalies at the 10-millibar level.
Following a failed attempt at a (very early) stratospheric warming event, which would have originated in the Bering Sea / North America region in late October, colder than normal air temperatures overspread the region, indicative of a strengthening of the polar vortex at that altitude. However, around November 12th, two areas of warming began blossoming at this level of the atmosphere- in western Europe, and in East Asia.

The warming in East Asia is important, as stratospheric warming events that form in the region have an easy path to bloom northward through the Bering Sea and initiate a stratospheric warming event. This time around, the warming in Japan seems to have shifted west, as warmer than normal temperatures in Europe have dominated.

For now, the mass of warmer air continues to bide its time over Europe, and may make a move towards the Arctic Circle within the next couple of weeks. However, we'll need to take a look at other layers of the stratosphere too, since the 10-millibar layer (and at higher altitudes) is notorious for being volatile in the nature of such warmings.

CPC
Animation of temperature anomalies at the 30-millibar level.
We now head down the latter a couple rungs to see temperature anomalies at the 30-millibar level. Following the late-October failed attempt at a warming event (which, you'll notice, was quite weaker at this level than at the 10-millibar level), colder than normal temperatures engulfed North America at this section of the stratosphere. Similar to how you need to check multiple layers of the stratosphere to see the depth (or lack thereof) of a possible warming event, the display of such cold temperatures at both the 10-millibar and 30-millibar layers is a testament to how strong the colder than normal temperatures actually were, and a testament to why that late-October warming didn't pan out.

On an interesting note, observe how that mass of warmer than normal temperature anomalies over Europe is actually warmer (in anomaly terms) than that at the 10-millibar level. This is rather uncommon, as you'll typically see the strongest anomalies higher up in the atmosphere, not lower in the atmosphere. I interpret that as a sign that this warming event may be "for real", but of course only time will tell for sure.

Also interesting is how that mass of warmer than normal temperatures over Europe at the 30-millibar mark is starting to shift the highest-magnitude anomalies slowly north and east, ever closer to the upper latitudes and Arctic Circle. When this process of northward movement starts, it generally either culminates in blooming into the Arctic Circle with a stratospheric warming event, or it's rejected and must stay at those lower latitudes, where often it then dissipates.

CPC
Animation of temperature anomalies at the 50-millibar level.
A little further down the road we come to the 50-millibar level of the stratosphere. The warm pool we've seen in the previous two animations is now one of a two-pronged approach, as the massive area of warmer than normal temperatures originated from two separate sources in East Asia and West Europe, now combined across Eurasia.

The strongest positive anomalies have recently combined in far north Eurasia, and seem to be trying to edge north. Again, this could be a precursor to a stratospheric warming event if that body of warm air were to advance into the Arctic Circle, and while I personally think that is certainly a possible outcome, I'm not completely sold just yet. Let's take a look at wind speeds to ascertain just how likely a stratospheric warming event may be.

FU-Berlin
The above chart is a forecast from the ECMWF model, and may at first appear complicated, but in reality is rather simple. Let's dissect it piece by piece.
The top panel shows observed wind speeds at the 1-millibar level in blue, and forecasted values in black. Sudden Stratospheric Warming (SSW) events will tend to reverse the wind direction, if not at least slow it down to near zero as that warmer air pushes north into the Arctic Circle and ridging tries to take hold. We see only a modest slowdown over the forecast period, signaling that a stratospheric warming event of any kind may not be influential to the weather pattern here in the troposphere.

The second panel shows the same parameter as the top panel, but this time for the 10-millibar and 30-millibar levels, which we analyzed earlier. We see a more pronounced slowdown in wind speeds at these levels over the forecast period, though not sufficiently near zero. Despite this, I do see this slowdown in wind speeds as a sign that this stratospheric warming event may occur, though again perhaps not to an influential degree.

The third panel shows two forms of fluxes, and while we won't discuss them in-depth, the increasing values over the forecast period once again show at least some degree of warming activity in the stratosphere. The final two panels are not as pertinent to the discussion.

To Summarize:

- Based on observations from multiple layers of the stratosphere, as well as forecasts from the ECMWF, a stratospheric warming event does appear likely to take place in the near future.
- An SSW event is not expected.
- While it remains to be seen if this will have a notable impact on the weather pattern here in the troposphere, it should at least provide further opportunities for cooler than normal weather conditions around the mid-late December period.

Andrew

Friday, November 24, 2017

2017-2018 Winter Synopsis

This brief outlook for the winter will be extracted from global sea surface temperatures.

ESRL
1) La Nina
As has been expected for a while, a La Nina has now emerged. In the image above, we see a stripe of below-normal sea surface temperature (SST) anomalies from the coast of Ecuador to the 180-degree longitude line. The deepest negative anomalies appear to be centered near the 120-degree west line of longitude, also known as the eastern part of the Nino 3.4 region, and extending a bit west into the center of the Nino 3.4 region. As such, this looks to be a 'textbook' La Nina, though then again rarely is anything in meteorology "textbook".

CPC
If we look at a cross-section of temperature anomalies along the Equator down to 450 meters below the surface, we see how this pool of below-normal waters has slowly but surely drifted up to the surface from ~150 meters under the surface. After struggling to do so in October, the cold pool has solidified itself on the surface, as we already saw in the top image.

I show this animation to provide evidence that this La Nina looks to be a formidable one, in the sense that it has a reservoir of below-normal temperature waters to continue gradually propagating to the surface. Previous La Nina and El Nino events have been foiled by the lack of a sturdy foundation like this, while others have been eroded away by a body of opposing-temperature waters out to the west, like is seen currently from the surface to 200 meters below. It remains to be seen if this body of colder waters will follow in those footsteps and be eroded over time, but for now it looks rather well-positioned to stick around into the spring.

Effects
ESRL
Typical precipitation anomalies in a La Nina
ESRL
Typical temperature anomalies in a La Nina
The above two images show the typical effects seen from a La Nina in precipitation, on top, and temperature, on bottom. In a La Nina regime, above-normal precipitation is generally seen in the Pacific Northwest, with drier than normal weather observed from southern California through the southern Plains, Gulf Coast and up into the Mid-Atlantic. Some dry signals of a lighter magnitude are also evident in the Midwest, but these are opposed by a swath of wetter than normal conditions generally seen in La Nina years, in the Ohio Valley.
In terms of temperature, cooler than normal conditions are typically observed from the Pacific Northwest through the Upper Midwest, just barely through Maine to the Atlantic coast. Warmer than normal conditions typically dominate the Southern U.S., most strongly in the Southeast U.S. and Texas and Louisiana.

But how do these effects come to pass?

ESRL
Typical 500mb geopotential height anomalies in a La Nina
In past La Nina winters, the mid-level flow has shaped up with a strong negative anomaly in western Canada, in what appears to be a core of cold and snowy weather. This is opposed by a strong ridge of high pressure, centered south of the Aleutian Islands but slanted so that it stretches from extreme northeast Russia to the waters just offshore of Baja California.

It is this ridge that shapes the temperature and precipitation anomalies. The Pacific jet stream rides the line between these two extremes, generally pushing southward from Alaska or the Gulf of Alaska, typically then beginning a northward turn when it hits central California. Note the slight positive anomaly in the above image along the Gulf Coast. This is a signal (albeit a very weak one) of the infamous Southeast Ridge that can emerge in La Nina years.

The Southeast Ridge is what I like to call the ridge of high pressure that will typically form over the Southeast in La Nina winters, leading to that maxima of warmer than normal temperatures in that region, but also pushing the jet stream north slightly as that ridge forms to divert the storm track through the Ohio Valley, leading to - you guessed it - the swath of above-normal precipitation usually seen in the Ohio Valley in La Nina winters.

Prediction: La Nina continues through winter and into the spring of 2018.

2) Bering Sea / North Pacific
Another point of interest on that sea surface temperature anomaly at the top of this publication is the patch of above-normal SSTs south of the Gulf of Alaska, in the northeast Pacific. Note how we see that swath of warmer waters seemingly corralled by average or slightly below-average water temperatures that appear to be hugging the Pacific Northwest/Alaska coast. If you think this looks like the negative phase of the Pacific Decadal Oscillation (PDO), you'd be right.

NCSU
Typical sea surface temperature anomalies in a negative PDO
As the above image shows, the negative phase of the PDO is identified primarily by a body of warmer than normal waters south of the Gulf of Alaska, surrounded by colder than normal waters along the coast of North America.

How does this tie in to the La Nina? I'm glad you asked!

University of Washington
Broader view of SST anomalies in the warm phase (positive) and cold phase (negative) PDO
As the above image shows, the warm phase of the PDO is generally associated with the El Nino phenomenon, as observed by the warmer colors along the Equator. Similarly, in a negative PDO, La Nina tends to dominate, with the composite image above showing cooler colors (and hence cooler water temperatures) along the Equatorial Pacific. As the sea surface temperatures suggest, we have seen the PDO as negative since July of this year.
NCEI
Graph showing recent values of the PDO
Effects
http://la.climatologie.free.fr/enso/enso-pdo3-english.htm#pdo
Since the negative phase of the PDO is generally seen with La Nina conditions in the Equatorial Pacific, you might expect the effects of a negative PDO to be similar to that of a La Nina. And you'd be right! As the above image shows, the negative phase of the PDO is shown to generally produce wetter than normal conditions in the Pacific Northwest, drier than normal conditions in the South and Southeast, and wetter than normal conditions in the Ohio Valley. This is remarkably similar to precipitation effects observed in a La Nina, and as such, the forecast adjusts to make this winter look more like a "textbook" La Nina winter.

Prediction: the negative PDO regime stays in place through the winter, though the lack of strong negative SST anomalies along the North American coast makes me wonder if this regime will stay in place through the spring of 2018.

3) Warmth by Nova Scotia
So we should just stop here and say this winter will look more or less like a 'typical' La Nina winter, we should just stop the article here, right? Not so fast. There's something else that's catching my eye.

NHC
Weekly SST Anomalies, valid 11/18/17
There's a swath of much warmer than normal SST anomalies centered just south of Nova Scotia, and this has the potential to become an issue for those in the East hoping for a cooler than normal winter.

In general, SST anomalies can be strong predictors of the presence of ridges or troughs over the longer-term. For instance, warmer than normal waters will tend to promote ridging in the longer-term, while cooler than normal waters will encourage troughing in the longer-term. Consequentially, I'm seeing the possibility for ridging becoming a rather common feature along the East Coast into eastern Canada, due to that swath of warmer than normal waters near Nova Scotia.

It's also entirely possible this actually promotes colder weather for the East, by encouraging ridging that then pushes north into Greenland to promote the negative phase of the North Atlantic Oscillation (NAO). However, the negative NAO is typically encouraged by warmer than normal waters *around* Greenland, not well to the south and west, like by Nova Scotia. Time will tell, of course, but I find this factor to be more likely to encourage a warmer winter for the East than a colder winter.

Prediction: Ridging becomes more prevalent than stormier weather in the Canadian Maritimes, potentially working in tandem with the La Nina / negative PDO-induced Southeast Ridge to push the jet stream and primary storm track a little further north and west, affecting both the Ohio Valley and the Midwest.

4) Warm Waters in the Bering Sea
One final sea surface temperature-related factor to discuss is the body of warmer than normal waters present in the Bering Sea southward into the north-central Pacific.

As we discussed previously, SST anomalies can promote longer-term ridging or troughing patterns. This still applies here in the Pacific, and may also complicate the forecast further. The presence of warmer than normal waters in the north-central Pacific and Bering Sea could promote a strong ridge, perhaps evolving into a blocking pattern, which would then trigger a trough forming in the Gulf of Alaska down along the West Coast, similar to the pattern we are in as I type this:

CPC
Analysis of 500-millibar geopotential height anomalies in five-day tranches over the last month
Over the last month or so, we've seen a persistent blocking ridge in the north-central Pacific into the Bering Sea. However, the troughing downstream of this ridge has been variable, moving from the West Coast from 11/3-11/7 to the waters just south of the Gulf of Alaska from 11/18-11/22. The former period saw stormier weather in the West, while the latter period saw a ridge form.
This goes to show how, even though the ridge remained relatively constant in the Bering Sea region, the effects downstream are not as certain. This will add some more uncertainty to the forecast for the coming winter, should these warmer than normal waters remain in the north-central Pacific and Bering Sea.

Prediction: A ridge present in the Bering Sea would introduce uncertainty to the winter forecast, and likely result in stormier weather along the West U.S., which in turn would most likely result in a warmer forecast for the U.S. as a whole.

To Summarize:

- Currently expecting a cooler than normal winter for the far northern Plains and Upper Midwest into New England as a result of the negative PDO and La Nina.
- Wetter than normal conditions likely for the Ohio Valley and eastern Midwest, with drier than normal conditions expected to prevail in the Southeast, Gulf Coast and Deep South.
- The La Nina & negative PDO combination should dictate the broader weather pattern through the winter, with warmer waters in the Bering Sea encouraging meridional flow in the Pacific, and likely an active Pacific jet.

Graphical Forecast
Andrew

Long-Range Forecast: November 24th - December 21st, 2017

This is a long-range forecast for the November 24th thru December 21st, 2017.

Weeks 1 and 2

We begin with the weekly forecasts from the CFS model, looking at the Week 1 and 2 timeframe.
NCEP / CPC
The top panel shows 500-millibar geopotential height anomalies from November 24th thru November 30th, with the same parameter shown on the bottom panel from December 1st thru December 7th.

We first analyze the top panel, and see a quite warm pattern set up for the country through the end of the month. This warmth stems from the jet stream being forced north as a strong blocking pattern, present since late October (as seen below), has set up in the Pacific just south of the Aleutian Islands.
NCEP / CPC
This blocking pattern has allowed a persistent roughing pattern to emerge in the Gulf of Alaska into the Pacific Northwest, which as you can see from November 9th onward in the above animation, has pumped a ridge up across the South U.S. into the central and eastern states. The East has been increasingly unaffected by this, as the last handful of frames in the animation show a negative North Atlantic Oscillation (NAO) pattern emerge as a strong ridge has blossomed over Greenland. This has allowed a trough to build down through southern Canada into the Northeast and Great Lakes region, keeping that area relatively cooler.

The Week 1 forecast, then, is more or less a continuation of this pattern, but the CFS anticipates the ridge in the South to bleed east and overrule that trough that's trying to push into the Northeast thanks to the negative NAO.

In Week 2, the bottom panel of the top image, we see a dramatically different pattern. The blocking pattern we are currently enduring in the northern Pacific has broken down in Week 2, with the CFS forecasting a strong low in the Bering Sea and a ridge well south of Alaska to promote a stronger Pacific jet stream and more zonal flow. With this ridge seen blossoming east towards the West Coast, that trough currently in the West U.S. is expected to weaken, leaving the Pacific jet with a red carpet rolled out to sweep into the U.S.

As is typically seen in this sort of Pacific pattern, a broad ridge is then forecasted to set up in the Central & Eastern U.S., focused in the Southeast (like one may typically see in a La Nina pattern). What we also see, however, is a very strong negative NAO pattern now having evolved, with a strong ridge over Greenland.
The actual temperature forecast from the CFS for these two weeks reflects the deductions we've made above:
NCEP / CPC
Weeks 3 and 4

NCEP / CPC
Weeks 3 and 4 show much less meridional flow over the Northern Hemisphere, albeit with a reduced magnitude in all troughs and ridges as the members of this ensemble diverge, diluting the mean forecasts shown here.
Most interestingly, we see a relatively strong ridge positioned right in the Arctic Circle, which would suggest a displacement of the (now infamous) polar vortex to the south. Where it goes if it was to be displaced south is very much to-be-determined, but early approximations in that top panel show below-normal anomalies (stormier conditions) in the Northeast U.S., northern Europe and Japan up through the Bering Sea.

Week 4 brings a similar picture to Week 3, though with a weaker ridge over the Arctic Circle and a resurgent ridge in the northeast Pacific and West Coast in tandem with a trough in the Gulf of Alaska. This again seems like a pattern where the Pacific jet stream may dominate, especially with that slight ridge shown well to the east of Florida that may resemble a Southeast Ridge if it keeps showing up in future forecasts. By this time, however, confidence is substantially lower, although the corresponding temperature graphics again are rather similar to what we've discussed above:
NCEP / CPC
Interestingly enough, the CFS isn't biting too hard on the possible cold wave in Week 3 as that ridge establishes itself in the Arctic Circle. We do see some light cooler-than-normal anomalies in the Southeast in this period, but the country as a whole is broadly above-normal.

To Summarize:
- Warmer than normal conditions are expected for the majority of the country through the end of November and the first week of December.
- Colder than normal conditions may present themselves in the Eastern U.S. by the second week of December with the emergence of a ridge in the Arctic Circle, but a strong Pacific jet stream may not permit this cooler weather to stay for a prolonged period of time.

Andrew